I was thinking about using machine learning to create a musical editor. I found a great dataset on kaggle.com, started to play around with it, and design the process. During my attempts, trying to use K-means clustering, with various conditional samplings, I stumbled upon a question — how do I measure feature importance in clustering.
The need for it is simple: I would like to juggle between some feature to get a few various clustering on one hand, and to have netter clustering on another. The basic thing was to do, of course, was to google it, and since it’s a Dev question, prefer answers on stackoverflow.com.
Surprisingly, the search results and answers didn’t point to a simple enough solution that can be implemented, and I found myself trying to resolve it alone, so his is what I came up with:
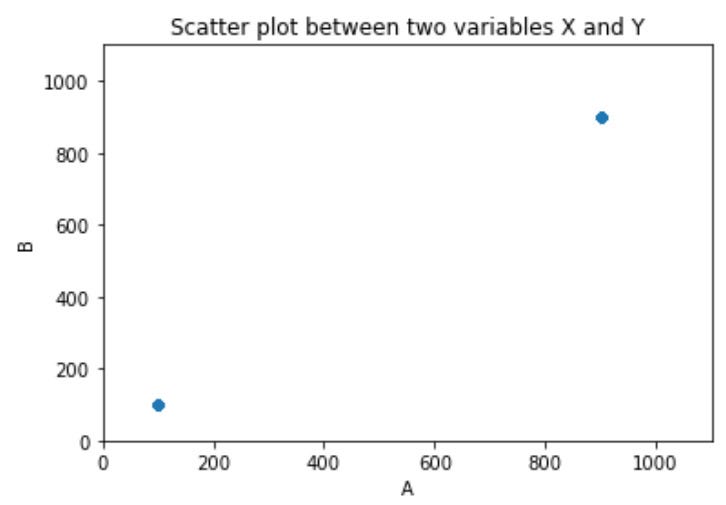
Let’s say we have a dataset with two dimensions: x and y, and let’s also say that we have 1,000 records in this dataset: 500 records with the values of x=100, y=100 and 500 records with the values of x=900, y=900.
We obviously have 2 clear clusters, very distinguished. The reason is that the variance between any record, in each cluster, is zero, which makes them ideal

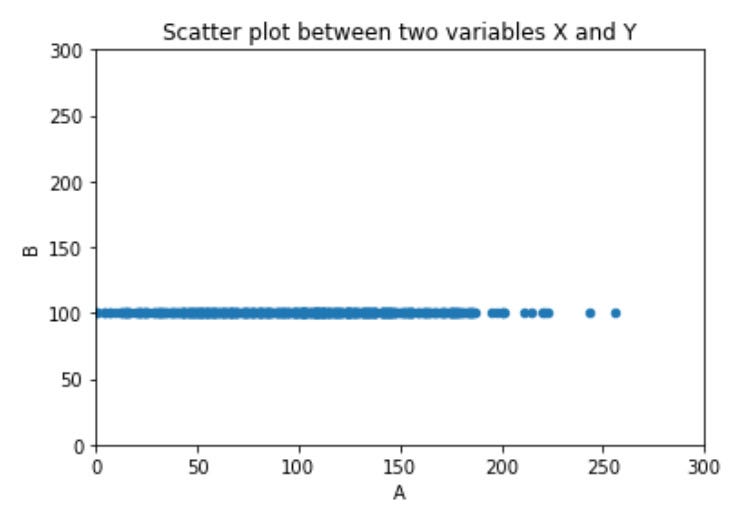
If we were to take this dataset, specifically the 500 records with the values of x=100 and y=100, keep their y values at 100, but change their x values, so that it would spread around a little bit, we will not necessarily be able to say that we have two clusters anymore… meaning that the larger the variance, the lesser the importance of the feature!

before we continue, small termination fix, for calculation purposes I preferred standard deviation, so I will use that from now on instead of variance.
The last issue to be handled is the scale. An average of 100, with a standard deviation of 50, might be a lot for the feature, but so far we’ve created a super simple example. it really is feature depandant: If the feature’s normal scale if between -500 and 500 we’ll treat it differently then if the scale will be between 0 and 150.

For that reason, we need to have the scale normalized. what we can do is take the maximum and minimum values for this particular feature, calculate their difference, and get their scale. Now, we can check the standard deviation in relation to the scale and get a normalized feature importance
Our feature importance, as it stands now, has two features: it’s between 0 and 1, and the lower the number, the higher the importance
Since our intuition is usually the opposite — the higher the number the more important the feature, we can simply normalize it again having it deducted from 1
so our simple formula for feature importance is:
1 — (std(x) / (max(x) — min(x))
and now, I can go about continuing to break my head with the ML musical editor
the feature importance class code is maintained here
GitHub – guylouzon/python-stuff
more data related articles on the data channel
https://interq.link/42/6×7.php?v=webapp&channel=156
Continue reading: Creating Clustering Feature importance